About Our Transportation Challenges


OUR GROWING TRANSPORTATION DILEMNA
In February of 2015 U.S. DOT issued the first draft of a report intended to start a national conversation about transportation. It was followed in January of this year by “Beyond Traffic: 2045 Final Report”. The report’s central purpose was to create awareness of the problems facing our current transportation systems, how they threaten our children and grandchildren’s future, and to discuss possible solutions.
OUR POPULATION GROWTH
In 2015 the total population of our country was 320 million people. By 2045 the total is expected to have increased by 70 million. This means that in the next 30 years our size will grow by adding more than the equivalent populations of New York, Texas and Florida. By 2045 it is estimated that our country’s population will have reached 390 million.
SOUTHERN CALIFORNIA’s GROWTH
Most of our country’s growth will take place in 11 “megaregions” spread from coast to coast. The Southern California megaregion is expected to absorb the most growth of them all. Southern California’s population back in 2000 was just under 22 million. It is expected to grow by nearly one third (31%), or by nearly 7 million more people, by the year 2025. Per the 2010 census the San Diego region had a population of 3.1 million people which is projected to grow by 1.3 million (42%) by 2050. Key problems such as traffic congestion, pollution, affordable housing and others discussed herein will also increase.
OUR TRAFFIC CONGESTION
OUR TRAFFIC CONGESTION
According to the transportation analytics firm Inrix, in 2016 Los Angeles topped “the list of the world’s most gridlocked cities, with drivers spending 104 peak hours in congestion in 2016, followed by Moscow (91 hours), New York (89 hours), San Francisco (83 hours) and Bogota (80 hours). In addition to Los Angeles, New York and San Francisco, Atlanta and Miami also ranked in the top 10 most congested cities in the world out of 1,064 cities analyzed.” A March 5, 2016 L.A Times article about another Inrix study ranked San Diego as only the 14th most congested city in the U.S. – however, population growth will soon create the same level of congestion as that of Los Angeles for all of Southern California’s “megaregion”.
THE FUTURE OF WORLD MOBILITY

Bill Ford, Henry Ford’s great grandson and executive chair of Ford Motor Company, presented his views on population growth globally and its effect on mobility at a “Ted Talk”
(https://www.ted.com/talks/bill_ford_a_future_beyond_traffic_gridlock).
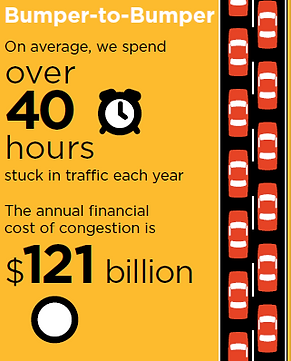
While the average American spends a week a year stuck in traffic jams, the average Beijing driver has a five-hour commute and has even experienced a 100 mile long traffic jam lasting 11 days. While our world’s population of 6.8 billion is expected to grow to 9 billion during our lifetimes; and while the 800 million cars presently on our world’s roads are expected to grow from between 2 and 4 billion by 2050; and with 75% of the world’s future population expected to live in cities (with 50 of them having a population of 10 million or more), gridlock will stifle economic growth, food delivery and health care.
OUR MOVEMENT OF GOODS
At present, 54 million tons of freight move across America on a daily basis. Congestion wastes $27 billion worth of time and fuel annually. By the year 2040 our freight volume is projected to grow to 29 billion tons annually – an increase of 45%. Also, along with the increase in volume, the value of freight is projected to grow by $39 trillion – or by 125%. It is estimated this will contribute to nearly 30,000 miles of our busiest highways being clogged on a daily basis.


High tides and flooding impact
Highway 80 leading to Tybee Island, GA


OUR INCOME INEQUALITY
Over the past several decades wages have stagnated for working class families as their cost of living has increased.This has combined to adversely impact a growing segment of our population.The top 10 percent of income-earning families now earn as much income as the remaining 90 percent. Middle- and low-income American households spend, on average, nearly 20 percent of their income on transportation and 40 percent on housing - higher shares than for wealthier Americans - and the availability of affordable housing has decreased causing a rise in homelessness. Despite this crunch, our increasing mobility difficulties cause many working class families to turn away from using less expensive (but inconvenient and time consuming) transit and to instead purchase a car. The decision to purchase an automobile pushes transportation into its rank of being the second largest expense for U.S. households as a whole.
OUR TRAFFIC INJURIES & DEATHS
In the U.S. alone 35,092 people died and 2.4 million people were injured in traffic crashes in 2015. The National Safety Council estimates that the fatalities grew to 40,000 people in 2016 and that the total cost of accidents was $432 billion (a 12% increase for all of the deaths, injuries, and property damage). On a global scale, the World Health Organization reported there were 1.25 million traffic deaths on roads in 2013. Ultimately, the automation and connective capabilities now under development for our vehicles will likely prevent many of the crashes caused by unsafe driving.
OUR CHANGING CLIMATE
Scientists say we need to avoid an increase of 2 degrees Fahrenheit to prevent the most catastrophic impacts of climate change. It has been estimated that our temperature is currently on track to rise by 2½ degrees Fahrenheit by 2050. Globally, more than 10 of our warmest years have occurred since 1998. The year 2016, for the third year in a row, set the record as the Earth’s warmest. Droughts and wildfires in the Western U.S. cost over $30 billion in 2012 alone. Melting ice from polar caps and elsewhere are predicted to cause sea level rise by up to 1 foot by 2045 and to 4 feet by 2100. Rising sea levels will place much of the United States’ coastline, including portions of major eastern cities such as Boston, Charleston and Miami, under water.
In California, the City of Imperial Beach, the County of San Mateo and the County of Marin have each brought lawsuits against major oil companies seeking to recover damages caused by rising sea levels.
OUR GHG EMISSIONS
The U.S. DOT’s Blue Paper reports that our transportation sector produces 28% of our country’s greenhouse gas (“GHG”) emissions. This makes it the second biggest source of GHGs in the country. In California, our state’s Global Warming Solutions Act of 2006 (AB 32) requires that the California Air Resources Board (“CARB”) determine the statewide 1990 GHG emission level and approve a statewide greenhouse gas emissions limit, equal to the 1990 level, to be achieved by 2020. In 2016 CARB reported that at 36% California’s transportation sector had been the state’s largest contributor of GHGs. The Los Angeles and San Diego transportation sectors have In the past both been reported as contributing more than 45% of their region’s GHGs. As an add on to “Our GHG Emissions” could we also say “Aside from impacts on climate The Economist recently (August 12th, 2017) reported that one study has found that 53,000 Americans die each year due to auto emissions as opposed to 34,000 annual deaths from auto accidents. Worldwide, outdoor air pollution contributes to 3.7 million deaths a year.
OUR TRANSIT PROBLEMS
By 2045 our population will have increasingly moved towards large metropolitan areas. However, these metropolitan areas will not look like the cities of 100 or even 50 years ago. They will be much larger and much less dense, with new investments and developments being located outside the urban core where land is less expensive. Short of land-use plans that expressly curtail it, sprawl is likely to remain a dominant development pattern and, if we do not act, congestion will be much more widespread. Less dense settlement patterns can make it more expensive to provide transit services as major expansions of rail and public transit systems cost billions of dollars.
THE IMPACT ON SOUTHERN CALIFORNIA
Over the past few decades transit services built in corridors have expanded in less dense cities like Los Angeles and San Diego. As a result, transit as a whole has become less fuel efficient and more carbon intensive. Per news articles, it has been reported that only 5.1% of the trips in the City of San Diego (this percentage is higher in the more dense downtown segment) are made via transit (buses, trolleys and commuter rail). A January 16, 2016 L.A. Times article reports that “For almost a decade, transit ridership has declined across Southern California despite enormous and costly efforts by top transportation officials to entice people out of their cars and onto buses and trains. The Los Angeles County Metropolitan Transportation Authority, the region's largest carrier, lost more than 10% of its boardings from 2006 to 2015, a decline that appears to be accelerating. Despite a $9-billion investment in new light rail and subway lines, Metro now has fewer boardings than it did three decades ago, when buses were the county's only transit option … The decline suggests that Southern California policymakers are falling short of one of their longtime goals: drawing drivers out of their cars and onto public transportation”
CALII’s EFFORT
While the current transit investment remains a significant benefit for many who cannot afford a car, its ridership has not met expectations. While these same transit systems are being counted on to reduce traffic congestion, greenhouse gases and the region's reliance on fossil fuels (the San Diego Climate Action Plan – “CAP” – is based on transit increasing its share of ridership from 5.1% to 12% by 2020 and to 25% by 2035) it is increasingly apparent that this will not be accomplished without change. It is CALII’s goal to support research on the development and deployment of innovative technology (based upon networks as opposed to corridors) to resolve and/or improve upon issues such as transit’s first/last mile problem. CALII believes this could help make those billions already invested in transit more productive and also assist current policies (such as San Diego’s CAP) to meet their goals by actually changing the way people get to work. By reducing the time and inconvenience spent commuting via transit (by use of networks to reduce the first/last mile problem) more commuters would be encouraged to rely on transit in order to reduce car trips and GHGs.
